Chapter 1 Introduction
Please note that you are currently looking at the latest version of “HR Analytics in R.”
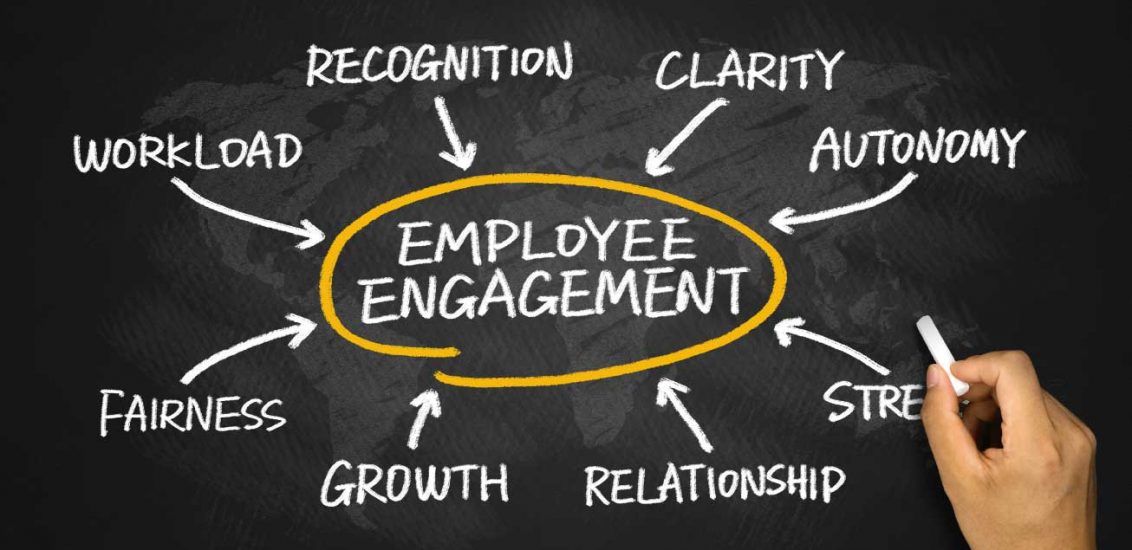
The intention of this book is to encourage more ‘data driven’ decisions in HR. HR Analytics is not anymore a nice-to-have addon but rather the way HR practitioners should conduct HR decision making in the future. Where applicable, human judgement is ‘added’ onto a rigorous analysis of the data done in the first place.
To achieve this ideal world, I need to equip you with some fundamental knowledge of R and RStudio, which are open-source tools for data scientists. I am well aware that on one side you want to do something for your career in HR, however you are most likely completely new to coding.
![]()
Help! I’m new to R and RStudio and I need to learn about them! However, I’m completely new to coding! What do I do?
If you’re asking yourself this question, then you have come to the right place! There is no better moment to ride the wave of disruptions taking place now in HR.
- Are you looking to learn about HR Analytics utilising the power of R"? Then start with our Introduction for Students.
- Are you looking to contribute to “HR Analytics in R?” Then click here for information on how.
- Are you curious about the publishing of this book? Then click here for more information on the open-source technology, in particular R Markdown and the bookdown package.
This is version 1.1.0 of “HR Analytics in R” published on October 10, 2020. While a PDF version of this book can be found here, this is very much a work in progress with many things that still need to be fixed. I appreciate your patience.
1.1 Introduction for students
This book assumes no prerequisites: no algebra, no calculus, and no prior programming/coding experience. This is intended to be a gentle introduction to the practice of analyzing data and answering questions using data the way data scientists, statisticians and other researchers would.
Working with the material
You can work your way through the materials by clicking on the arrows to the left and right at the bottom of each page. Alternatively, there is a collapsible contents bar on the left hand side.
If you need to find something specific, you can use the search icon. Typing in a word or phrase will filter the contents bar to relevant sections.
The book by default renders black sans serif on a white background. You can use the A to amend the appearance of the book to make it easier to process, whether that’s a larger font, a serif font, or a different colour scheme.
The edit button takes you straight to github, where you can propose editorial changes.
Conventions
Throughout this book various conventions will be used.
In terms of basic formatting:
- This is standard text.
This is code or a symbol- This is a Keyboard Key!
- This is the first time I mention something important
This is a book about coding, so expect code blocks. Code blocks will typically look like this:
"this is a code block"[1] "this is a code block"Directly underneath it, normally starting with two hash symbols (##) is the result of the code executing.
## [1] 'this is a code block'`There will also be callouts throughout the book. Some are for information, some expect you to do things.
Anything written here should be read carefully before proceeding.
This is a tip relating to what I’ve just said.
This is kind of like a tip but is for when you’re getting into trouble and need help.
This is something I recommend you do as you’re reading.
In Figure 1.1 I present a flowchart of what you’ll cover in this book. You’ll first get started with data in Chapter 2, where you’ll learn about the difference between R and RStudio, start coding in R, understand what R packages are, and explore your first dataset: all domestic departure flights from a New York City airport in 2013. Then
- Data science: You’ll assemble your data science toolbox using
tidyversepackages. In particular: - Data modeling: Using these data science tools and helper functions from the
moderndivepackage, you’ll start performing data modeling. In particular: - Statistical inference: Once again using your newly acquired data science tools, I’ll unpack statistical inference using the
inferpackage. In particular: - Data modeling revisited: Armed with your new understanding of statistical inference, you’ll revisit and review the models you constructed in Ch.6 & Ch.7. In particular:
- HR Analytics - data driven decision making: The intention is to provide real tangible examples of the application of data science to HR, to illustrate the data science process in the HR context, and to show that the scope mentioned previously in this article, isn’t just theoretical - it’s real. The last and most important module shall illustrate current best practices of a structured process of thinking and analysis.
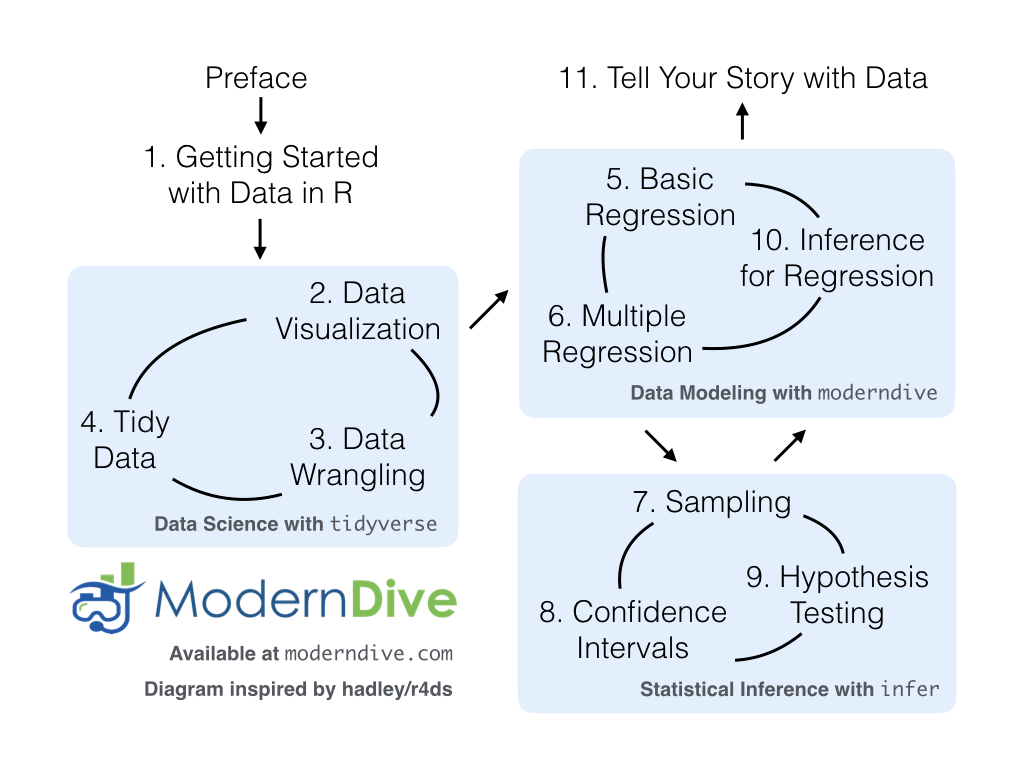
FIGURE 1.1: ModernDive Flowchart
1.1.1 What you will learn from this book
I hope that by the end of this book, you’ll have learned
- How to use R to explore data.
- How to answer statistical questions using tools like confidence intervals and hypothesis tests.
- How to effectively create “data stories” using these tools.
What do I mean by data stories? I mean any analysis involving data that engages the reader in answering questions with careful visuals and thoughtful discussion, such as How strong is the relationship between per capita income and crime in Chicago neighborhoods? and How many f**ks does Quentin Tarantino give (as measured by the amount of swearing in his films)?. Further discussions on data stories can be found in this Think With Google article.
For other examples of data stories constructed by students like yourselves, look at the final projects for two courses that have previously used ModernDive:
- Middlebury College MATH 116 Introduction to Statistical and Data Sciences using student collected data.
- Pacific University SOC 301 Social Statistics using data from the fivethirtyeight R package.
This book will help you develop your “data science toolbox,” including tools such as data visualization, data formatting, data wrangling, and data modeling using regression. With these tools, you’ll be able to perform the entirety of the “data/science pipeline” while building data communication skills (see Subsection 1.1.2 for more details).
In particular, this book will lean heavily on data visualization. In today’s world, we are bombarded with graphics that attempt to convey ideas. I will explore what makes a good graphic and what the standard ways are to convey relationships with data. You’ll also see the use of visualization to introduce concepts like mean, median, standard deviation, distributions, etc. In general, I’ll use visualization as a way of building almost all of the ideas in this book.
To impart the statistical lessons in this book, I have intentionally minimized the number of mathematical formulas used and instead have focused on developing a conceptual understanding via data visualization, statistical computing, and simulations. I hope this is a more intuitive experience than the way statistics has traditionally been taught in the past and how it is commonly perceived.
Finally, you’ll learn the importance of literate programming. By this I mean you’ll learn how to write code that is useful not just for a computer to execute but also for readers to understand exactly what your analysis is doing and how you did it. This is part of a greater effort to encourage reproducible research (see Subsection 1.1.3 for more details). Hal Abelson coined the phrase that I will follow throughout this book:
“Programs must be written for people to read, and only incidentally for machines to execute.” I understand that there may be challenging moments as you learn to program. Both of us continue to struggle and find ourselves often using web searches to find answers and reach out to colleagues for help. In the long run though, we all can solve problems faster and more elegantly via programming. I wrote this book as our way to help you get started and you should know that there is a huge community of R users that are always happy to help everyone along as well. This community exists in particular on the internet on various forums and websites such as stackoverflow.com.
1.1.2 Data/science pipeline
You may think of statistics as just being a bunch of numbers. I commonly hear the phrase “statistician” when listening to broadcasts of sporting events. Statistics (in particular, data analysis), in addition to describing numbers like with baseball batting averages, plays a vital role in all of the sciences. You’ll commonly hear the phrase “statistically significant” thrown around in the media. You’ll see articles that say “Science now shows that chocolate is good for you.” Underpinning these claims is data analysis. By the end of this book, you’ll be able to better understand whether these claims should be trusted or whether we should be wary. Inside data analysis are many sub-fields that I will discuss throughout this book (though not necessarily in this order):
- data collection
- data wrangling
- data visualization
- data modeling
- inference
- correlation and regression
- interpretation of results
- data communication/storytelling
These sub-fields are summarized in what Grolemund and Wickham term the “Data/Science Pipeline” in Figure 1.2.
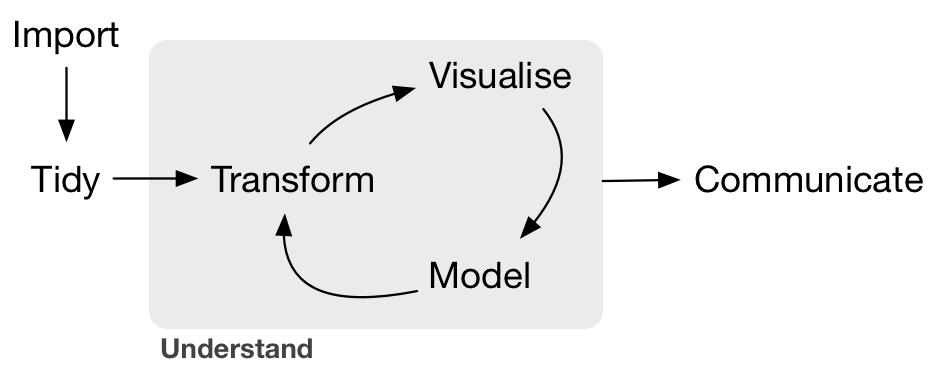
FIGURE 1.2: Data/Science Pipeline
I will begin by digging into the gray Understand portion of the cycle with data visualization, then with a discussion on what is meant by tidy data and data wrangling, and then conclude by talking about interpreting and discussing the results of our models via Communication. These steps are vital to any statistical analysis. But why should you care about statistics? “Why did they make me take this class?”
There’s a reason so many fields require a statistics course. Scientific knowledge grows through an understanding of statistical significance and data analysis. You needn’t be intimidated by statistics. It’s not the beast that it used to be and, paired with computation, you’ll see how reproducible research in the sciences particularly increases scientific knowledge.
1.1.3 Reproducible research
“The most important tool is the mindset, when starting, that the end product will be reproducible.” – Keith Baggerly Another goal of this book is to help readers understand the importance of reproducible analyses. The hope is to get readers into the habit of making their analyses reproducible from the very beginning. This means I’ll be trying to help you build new habits. This will take practice and be difficult at times. You’ll see just why it is so important for you to keep track of your code and well-document it to help yourself later and any potential collaborators as well.
Copying and pasting results from one program into a word processor is not the way that efficient and effective scientific research is conducted. It’s much more important for time to be spent on data collection and data analysis and not on copying and pasting plots back and forth across a variety of programs.
In a traditional analyses if an error was made with the original data, we’d need to step through the entire process again: recreate the plots and copy and paste all of the new plots and our statistical analysis into your document. This is error prone and a frustrating use of time. I’ll see how to use R Markdown to get away from this tedious activity so that we can spend more time doing science.
“We are talking about computational reproducibility.” - Yihui Xie Reproducibility means a lot of things in terms of different scientific fields. Are experiments conducted in a way that another researcher could follow the steps and get similar results? In this book, I will focus on what is known as computational reproducibility. This refers to being able to pass all of one’s data analysis, data-sets, and conclusions to someone else and have them get exactly the same results on their machine. This allows for time to be spent interpreting results and considering assumptions instead of the more error prone way of starting from scratch or following a list of steps that may be different from machine to machine.
1.1.4 Final note for students
At this point, if you are interested in instructor perspectives on this book, ways to contribute and collaborate, or the technical details of this book’s construction and publishing, then continue with the rest of the chapter below. Otherwise, let’s get started with R and RStudio in Chapter 2!
1.2 Introduction for instructors
This book is inspired by the following books:
- “Mathematical Statistics with Resampling and R” [2],
- “OpenIntro: Intro Stat with Randomization and Simulation” [4], and
- “R for Data Science” [6].
The first book, while designed for upper-level undergraduates and graduate students, provides an excellent resource on how to use resampling to impart statistical concepts like sampling distributions using computation instead of large-sample approximations and other mathematical formulas. The last two books are free options to learning introductory statistics and data science, providing an alternative to the many traditionally expensive introductory statistics textbooks.
When looking over the large number of introductory statistics textbooks that currently exist, I found that there wasn’t one that incorporated many newly developed R packages directly into the text, in particular the many packages included in the tidyverse collection of packages, such as ggplot2, dplyr, tidyr, and broom. Additionally, there wasn’t an open-source and easily reproducible textbook available that exposed new learners all of three of the learning goals listed at the outset of Subsection 1.1.1.
1.2.1 Who is this book for?
This book is intended for instructors of traditional introductory statistics classes using RStudio, either the desktop or server version, who would like to inject more data science topics into their syllabus. I assume that students taking the class will have no prior algebra, calculus, nor programming/coding experience.
Here are some principles and beliefs I kept in mind while writing this text. If you agree with them, this might be the book for you.
- Blur the lines between lecture and lab
- With increased availability and accessibility of laptops and open-source non-proprietary statistical software, the strict dichotomy between lab and lecture can be loosened.
- It’s much harder for students to understand the importance of using software if they only use it once a week or less. They forget the syntax in much the same way someone learning a foreign language forgets the rules. Frequent reinforcement is key.
- Focus on the entire data/science research pipeline
- I believe that the entirety of Grolemund and Wickham’s data/science pipeline should be taught.
- I believe in “minimizing prerequisites to research”: students should be answering questions with data as soon as possible.
- It’s all about the data
- I leverage R packages for rich, real, and realistic data-sets that at the same time are easy-to-load into R, such as the
nycflights13andfivethirtyeightpackages. - I believe that data visualization is a gateway drug for statistics and that the Grammar of Graphics as implemented in the
ggplot2package is the best way to impart such lessons. However, I often hear: “You can’t teachggplot2for data visualization in intro stats!” I, like David Robinson, are much more optimistic. dplyrhas made data wrangling much more accessible to novices, and hence much more interesting data-sets can be explored.
- I leverage R packages for rich, real, and realistic data-sets that at the same time are easy-to-load into R, such as the
- Use simulation/resampling to introduce statistical inference, not probability/mathematical formulas
- Instead of using formulas, large-sample approximations, and probability tables, statistical concepts using resampling-based inference.
- This allows for a de-emphasis of traditional probability topics, freeing up room in the syllabus for other topics.
- Early exposure to analytics and computing
- Computing skills are essential to working with data in the 21st century even for HR managers. Given this fact, I feel that an early exposure to computing can only be of benefit to the whole HR community.
- I am not teaching a course on coding/programming per se, but rather just enough of the computational and algorithmic thinking necessary for performing a data analysis in HR.
- Complete reproducibility and customisability
- I am frustrated when people talk about HR Analytics, without giving the source code and the data itself. I give you the source code for all examples as well as the whole book!
- If you want you can even use my book as a starting point and customise for your own non-profit training. For more about how to make this book your own, see About this Book.
1.3 Connect and contribute
If you would like to connect with “HR Analytics in R,” check out the following links:
- If you would like to receive periodic updates about HR Analytics, then please sign up for my mailing list. You will receive receive bi-weekly notififications about my new blog posts.
- Please feel free to contact me at info@hranalytics.live .
- I am on Twitter at h_feddersen.
If you would like to contribute to “HR Analytics in R,” there are many ways! Let’s all work together to make this book as great as possible for as many students as possible!
- Please let me know if you find any errors, typos, or areas from improvement on my GitHub issue page page. I will fix it as soon as possible.
- If you are familiar with GitHub and would like to contribute even more, please see Section 1.4 below.
I would like to thank Moderndive for their inspirational presentation at a recent R user conference and for their generous example on how to set up a bookdown book and for their introductory pages on how to start using R.
1.4 About this book
This book was written using RStudio’s bookdown package by Yihui Xie [9]. This package simplifies the publishing of books by having all content written in R Markdown.
Latest published version, still in development The most up-to-date version, which is still in development is available at https://hranalyticslive.netlify.com/
Source code The bookdown/R Markdown source code for the latest version of “HR Analytics in R” is available on Hendrik Feddersen’s GitHub repository page
Usage You can share this material with colleagues or for non-commercial purposes but you can’t resell or incorporate them into stuff you make money from.
- As a symbol of gratitude, I would expect at least that you to sign up for my mailing list.
- If you think my material is awesome and want to use it for commercial purposes, please contact me at info@hranalytics.live
Licence This work is licensed under a Creative Commons Attribution-NonCommercial 4.0 International License.

Creative Commons License
1.5 About the author
Who am I? I am Hendrik Feddersen, a long-standing HR practitioner passionate about HR Analytics and living in Amsterdam, the Netherlands.

- Email: info@hranalytics.live
- Webpage: https://hranalytics.live/
- Twitter: h_feddersen
- GitHub: https://github.com/Hendrik147